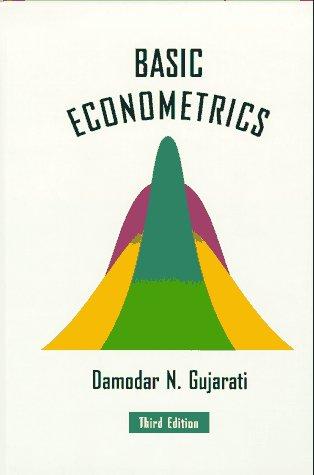
Basic Econometrics
Gujarati, Damodar N.
Provides An Introduction To Econometrics And The Developments In The Theory And Practice Of Econometrics. Part 1 Single-equation Regression Models -- 1 The Nature Of Regression Analysis 15 -- 1.1 Historical Origin Of The Term Regression 15 -- 1.2 The Modern Interpretation Of Regression 16 -- Examples 16 -- 1.3 Statistical Vs. Deterministic Relationships 19 -- 1.4 Regression Vs. Causation 20 -- 1.5 Regression Vs. Correlation 21 -- 1.6 Terminology And Notation 22 -- 1.7 The Nature And Sources Of Data For Econometric Analysis 23 -- Types Of Data 23 -- The Sources Of Data 24 -- The Accuracy Of Data 26 -- Exercises 28 -- Appendix 1a 29 -- 1a.1 Sources Of Economic Data 29 -- 1a.2 Sources Of Financial Data 31 -- 2 Two-variable Regression Analysis: Some Basic Ideas 32 -- 2.1 A Hypothetical Example 32 -- 2.2 The Concept Of Population Regression Function (prf) 36 -- 2.3 The Meaning Of The Term Linear 36 -- Linearity In The Variables 37 -- Linearity In The Parameters 37 -- 2.4 Stochastic Specification Of Prf 38 -- 2.5 The Significance Of The Stochastic Disturbance Term 39 -- 2.6 The Sample Regression Function (srf) 41 -- Exercises 45 -- 3 Two-variable Regression Model: The Problem Of Estimation 52 -- 3.1 The Method Of Ordinary Least Squares 52 -- 3.2 The Classical Linear Regression Model: The Assumptions Underlying The Method Of Least Squares 59 -- How Realistic Are These Assumptions? 68 -- 3.3 Precision Or Standard Errors Of Least-squares Estimates 69 -- 3.4 Properties Of Least-squares Estimators: The Gauss-markov Theorem 72 -- 3.5 The Coefficient Of Determination R2: A Measure Of Goodness Of Fit 74 -- 3.6 A Numerical Example 80 -- 3.7 Illustrative Examples 83 -- Coffee Consumption In The United States, 1970-1980 83 -- Keynesian Consumption Function For The United States, 1980-1991 84 -- 3.8 Computer Output For The Coffee Demand Function 85 -- 3.9 A Note On Monte Carlo Experiments 85 -- Exercises 87 -- Problems 89 -- Appendix 3a 94 -- 3a.1 Derivation Of Least-squares Estimates 94 -- 3a.2 Linearity And Unbiasedness Properties Of Least-squares Estimators 94 -- 3a.3 Variances And Standard Errors Of Least-squares Estimators 95 -- 3a.4 Covariance Between B1 And B2 96 -- 3a.5 The Least-squares Estimator Of O2 96 -- 3a.6 Minimum-variance Property Of Least-squares Estimators 97 -- 3a.7 Sas Output Of The Coffee Demand Function (3.7.1) 99 -- 4 The Normality Assumption: Classical Normal Linear Regression Model (cnlrm) 101 -- 4.1 The Probability Distribution Of Disturbances Ui 101 -- 4.2 The Normality Assumption 102 -- 4.3 Properties Of Ols Estimators Under The Normality Assumption 104 -- 4.4 The Method Of Maximum Likelihood (ml) 107 -- 4.5 Probability Distributions Related To The Normal Distribution: The T, Chi-square (x2), And F Distributions 107 -- Appendix 4a 110 -- Maximum Likelihood Estimation Of Two-variable Regression Model 110 -- Maximum Likelihood Estimation Of The Consumption-income Example 113 -- Appendix 4a Exercises 113 -- 5 Two-variable Regression: Interval Estimation And Hypothesis Testing 115 -- 5.1 Statistical Prerequisites 115 -- 5.2 Interval Estimation: Some Basic Ideas 116 -- 5.3 Confidence Intervals For Regression Coefficients B1 And B2 117 -- Confidence Interval For B2 117 -- Confidence Interval For B1 119 -- Confidence Interval For B1 And B2 Simultaneously 120 -- 5.4 Confidence Interval For O2 120 -- 5.5 Hypothesis Testing: General Comments 121 -- 5.6 Hypothesis Testing: The Confidence-interval Approach 122 -- Two-sided Or Two-tail Test 122 -- One-sided Or One-tail Test 124 -- 5.7 Hypothesis Testing: The Test-of-significance Approach 124 -- Testing The Significance Of Regression Coefficients: The T-test 124 -- Testing The Significance Of O2: The X2 Test 128 -- 5.8 Hypothesis Testing: Some Practical Aspects 129 -- The Meaning Of Accepting Or Rejecting A Hypothesis 129 -- The Zero Null Hypothesis And The 2-t Rule Of Thumb 129 -- Forming The Null And Alternative Hypotheses 130 -- Choosing A, The Level Of Significance 131 -- The Exact Level Of Significance: The P Value 132 -- Statistical Significance Versus Practical Significance 133 -- The Choice Between Confidence-interval And Test-of-significance Approaches To Hypothesis Testing 134 -- 5.9 Regression Analysis And Analysis Of Variance 134 -- 5.10 Application Of Regression Analysis: The Problem Of Prediction 137 -- Mean Prediction 137 -- Individual Prediction 138 -- 5.11 Reporting The Results Of Regression Analysis 140 -- 5.12 Evaluating The Results Of Regression Analysis 140 -- Normality Test 141 -- Other Tests Of Model Adequacy 144 -- Exercises 145 -- Problems 147 -- Appendix 5a 152 -- 5a.1 Derivation Of Equation (5.3.2) 152 -- 5a.2 Derivation Of Equation (5.9.1) 152 -- 5a.3 Derivation Of Equations (5.10.2) And (5.10.6) 153 -- Variance Of Mean Prediction 153 -- Variance Of Individual Prediction 153 -- 6 Extensions Of The Two-variable Linear Regression Model 155 -- 6.1 Regression Through The Origin 155 -- R2 For Regression-through-origin Model An Illustrative Example: The Characteristic Line Of Portfolio Theory 159 -- 6.2 Scaling And Units Of Measurement 161 -- A Numerical Example: The Relationship Between Gpdi And Gnp, United States, 1974-1983 163 -- A Word About Interpretation 164 -- 6.3 Functional Forms Of Regression Models 165 -- 6.4 How To Measure Elasticity: The Log-linear Model 165 -- An Illustrative Example: The Coffee Demand Function Revisited 167 -- 6.5 Semilog Models: Log-lin And Lin-log Models 169 -- How To Measure The Growth Rate: The Log-lin Model 169 -- The Lin-log Model 172 -- 6.6 Reciprocal Models 173 -- An Illustrative Example: The Phillips Curve For The United Kingdom, 1950-1966 176 -- 6.7 Summary Of Functional Forms 176 -- 6.8 A Note On The Nature Of The Stochastic Error Term: Additive Versus Multiplicative Stochastic Error Term 178 -- Exercises 180 -- Problems 183 -- Appendix 6a 186 -- 6a.1 Derivation Of Least-squares Estimators For Regression Through The Origin 186 -- 6a.2 Sas Output Of The Characteristic Line (6.1.12) 189 -- 6a.3 Sas Output Of The United Kingdom Phillips Curve Regression (6.6.2) 190 -- 7 Multiple Regression Analysis: The Problem Of Estimation 191 -- 7.1 The Three-variable Model: Notation And Assumptions 192 -- 7.2 Interpretation Of Multiple Regression Equation 194 -- 7.3 The Meaning Of Partial Regression Coefficients 195 -- 7.4 Ols And Ml Estimation Of The Partial Regression Coefficients 197 -- Ols Estimators 197 -- Variances And Standard Errors Of Ols Estimators 198 -- Properties Of Ols Estimators 199 -- Maximum Likelihood Estimators 201 -- 7.5 The Multiple Coefficient Of Determination R2 And The Multiple Coefficient Of Correlation R 201 -- 7.6 Example 7.1: The Expectations-augmented Phillips Curve For The United States, 1970-1982 203 -- 7.7 Simple Regression In The Context Of Multiple Regression: Introduction To Specification Bias 204 -- 7.8 R2 And The Adjusted R2 207 -- Comparing Two R2 Values 209 -- Example 7.2: Coffee Demand Function Revisited 210 -- The Game Of Maximizing R2 211 -- 7.9 Partial Correlation Coefficients 211 -- Explanation Of Simple And Partial Correlation Coefficients 211 -- Interpretation Of Simple And Partial Correlation Coefficients 213 -- 7.10 Example 7.3: The Cobb-douglas Production Function: More On Functional Form 214 -- 7.11 Polynomial Regression Models 217 -- Example 7.4: Estimating The Total Cost Function 218 -- Empirical Results 220 -- Exercises 221 -- Problems 224 -- Appendix 7a 231 -- 7a.1 Derivation Of Ols Estimators Given In Equations (7.4.3) And (7.4.5) 231 -- 7a.2 Equality Between A1 Of (7.3.5) And B2 Of (7.4.7) 232 -- 7a.3 Derivation Of Equation (7.4.19) 232 -- 7a.4 Maximum Likelihood Estimation Of The Multiple Regression Model 233 -- 7a.5 The Proof That E(b12) = B2 + B3b32 (equation 7.7.4) 234 -- 7a.6 Sas Output Of The Expectations-augmented Phillips Curve (7.6.2) 236 -- 7a.7 Sas Output Of The Cobb-douglas Production Function (7.10.4) 237 -- 8 Multiple Regression Analysis: The Problem Of Inference 238 -- 8.1 The Normality Assumption Once Again 238 -- 8.2 Example 8.1: U.s. Personal Consumption And Personal Disposal Income Relation, 1956-1970 239 -- 8.3 Hypothesis Testing In Multiple Regression: General Comments 242 -- 8.4 Hypothesis Testing About Individual Partial Regression Coefficients 242 -- 8.5 Testing The Overall Significance Of The Sample Regression 244 -- The Analysis Of Variance Approach To Testing The Overall Significance Of An Observed Multiple Regression: The F Test 245 -- An Important Relationship Between R2 And F 248 -- The Incremental, Or Marginal, Contribution Of An Explanatory Variable 250 -- 8.6 Testing The Equality Of Two Regression Coefficients 254 -- Example 8.2: The Cubic Cost Function Revisited 255 -- 8.7 Restricted Least Squares: Testing Linear Equality Restrictions 256 -- The T Test Approach 256 -- The F Test Approach: Restricted Least Squares 257 -- Example 8.3: The Cobb-douglas Production Function For Taiwanese Agricultural Sector, 1958-1972 259 -- General F Testing 260 -- 8.8 Comparing Two Regressions: Testing For Structural Stability Of Regression Models 262 -- 8.9 Testing The Functional Form Of Regression: Choosing Between Linear And Log-linear Regression Models 265 -- Example 8.5: The Demand For Roses 266 -- 8.10 Prediction With Multiple Regression 267 -- 8.11 The Troika Of Hypothesis Tests: The Likelihood Ratio (lr), Wald (w), And Lagrange Multiplier (lm) Tests 268 -- The Road Ahead 269 -- Exercises 270 -- Problems 273 -- Appendix 8a 280 -- Likelihood Ratio (lr) Test 280 -- 9 The Matrix Approach To Linear Regression Model 282. Damodar N. Gujarati. International Edition-- Verso Of T.p. Includes Bibliographical References (p. 824-826) And Indexes.
| Name in long format: | Basic Econometrics |
|---|---|
| ISBN-10: | 0070252149 |
| ISBN-13: | 9780070252141 |
| Book pages: | 838 |
| Book language: | en |
| Edition: | 3rd |
| Binding: | Hardcover |
| Publisher: | McGraw-Hill Companies |
| Dimensions: | Height: 1.48 Inches, Length: 9.56 Inches, Weight: 2.7998707274 Pounds, Width: 6.76 Inches |

